Useful Things to Know about the VSCode Debugger
- SHIFT + Command + D will open debugger window
fn+f5starts the debugger you have currently selected if it’s not currently running- But if it is already running,
COMMAND+SHIFT+f5will restart it. tasks.jsonis another file sorta likelaunch.jsonthat lets us define these other tasks! Don’t totally get how it’s different, but it does have a cool option calledproblemMatcherthat can do regex matching on stdout to see what a process is saying and do stuff depending on that!- In the
breakpointswindow on the left, you can see all breakpoints you have and if hover over one, a pencil icon appears. If you press that pencil icon, you can customize the breakpoint to only run in a certain condition is met! This seems useful because it means you can debug in such a way that you are automatically stopping code execution where maybe there is a known problem but you’re no sure how to replicate it but have suspicions that it might be caused when a certain variable isundefinedor something. - On a sort of similar note, in the super useful
variablespane, you can add things to “watch”, which pics out particular variables of interested that you can watch mutate as they go if you’d like - In the
Call stackpane, there is a lot going on I don’t totally understand, but for the current line you are using (I think it is highlighted automatically?) if you press the little icon that looks like a paragraph with anundosymbol in it, that will take you back to your first breakpoint.

Gotchas
- Node breakpoints will be
unboundif node, or thenpmcommand you are using, isn’t run with the--inspectflag. - Sometimes, if you aren’t able to get to code within maps, loops, and function invocations, then you need to press the
step intobutton, which is like an arrow pointing down. This takes you into closures and scopes it seems.

- This is hopefully obvious to others, but it took me a few uses to understand that the configurations you define in your
launch.jsonhere:
{
  "version": "0.2.0",
  "configurations": [
      {
          "name": "Launch Server 🚀",
          "type": "node",
          "request": "launch",
          "runtimeExecutable": "npm",
          "runtimeArgs": ["run", "serve-debug"],
          "cwd": "${workspaceFolder}/server",
          "skipFiles": ["<node_internals>/**"],
          "outFiles": ["${workspaceFolder}/server/dist/**/*.js"],
          "env": {
              "NODE_ENV": "development"
          }
      },
      // This one works great but requires `npm run dev` to have been run already
      {
        "name": "Attach Chrome Debugger 🚀",
        "type": "chrome",
        "request": "launch",
        "url": "http://localhost:5173",
        "webRoot": "${workspaceFolder}/client",
        "sourceMaps": true
      },
      {
        "name": "Debug Frontend 🚀",
        "type": "chrome",
        "request": "launch",
        "url": "http://localhost:5173",
        "webRoot": "${workspaceFolder}/client",
        "sourceMaps": true,
        "preLaunchTask": "Run Frontend Dev Server"
      },
  ],
}
Will show up as Debugger option here:

It’s just along with (potentially) reasonable presets that VSCode seems to create for you by scanning things like your package.json. I think this relationship between the launch.json and the configuration UI would be a bit stronger if they’d go ahead and populate your launch.json with the presets they generate so we could get a little 101 on what those presets look like in the form of a launch.json.
I am still getting the hang of the valid options for the launch.json but I’ll keep reading the docs and eventually understand all the options.
Here are materials I could pull together that might help with that
Top Level VSCode Debugging Guide
Variables Reference (things like ${workspaceFolder})
Tasks.json Guide
VSCode’s debugging guide section here covers Launch Configs and they remind us that we can use control + Space to use intellisense to see suggestions for properties we can use for a specific debugger.
It’s probably at least reading through this section to understand the basics of launch.json configs.
General Guides
Typescript with Bun
x
The following launch.json allows us to run the debugger with individual TS files as if we were running them directly with bun.
{
  "type": "bun",
  "request": "launch",
  "name": "Debug Bun TypeScript",
  "program": "${file}",
  "cwd": "${fileDirname}"
}
Where does the bun type configuration come from? The bun VScode extension, which you’d need to have installed.
Testing with Jest in VSCode
VSCode has a nifty test explorer side tab that looks like a little test tube, where tests will show up if you have certain packages installed. I don’t think that the JEST package includes this support, but the official jest PLUGIN does which is cool.
Huh so I got these coverage results:
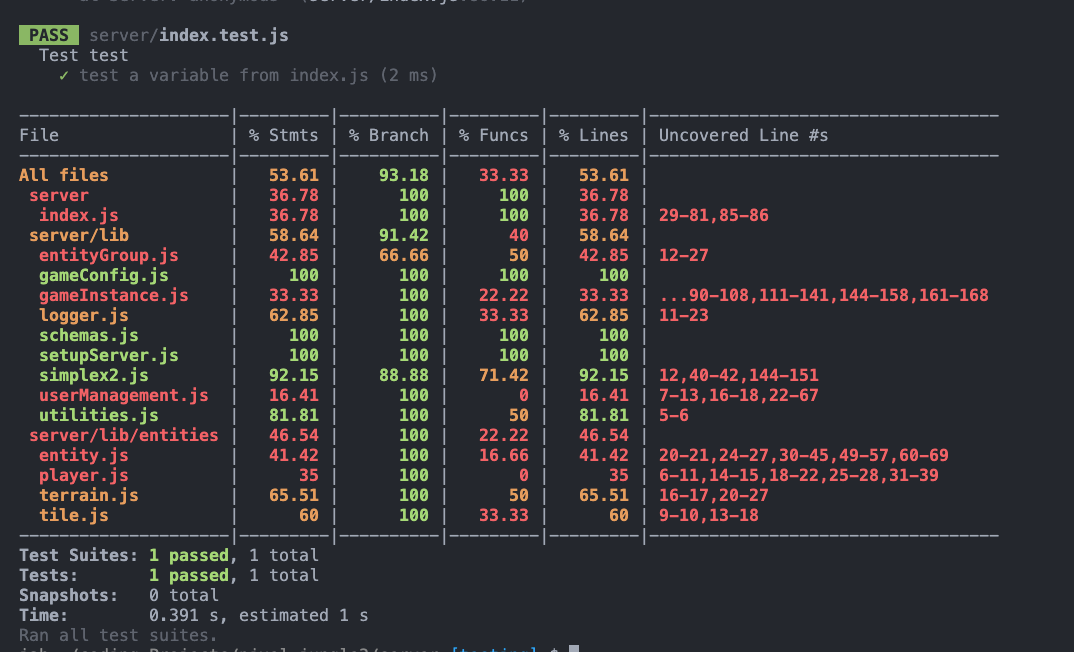
For literally only this test:
Kinda sus.
Gotchas:
- Apparrently it’s possibly to just have the extension disabled. If you don’t see Jest-WS as a tab on the bottom bar, it probably is, and that may be why aren’t seeing your tests showing up in the test explorer.
Using Jest and Playwright together
I don’t mean using playwright methods inside of jest or vice versa, although that could be cool. I’ve had enough configuration challenges as it is though.
Tips to self:
- I found that running playwright and jest out of the same directory level was really helpful
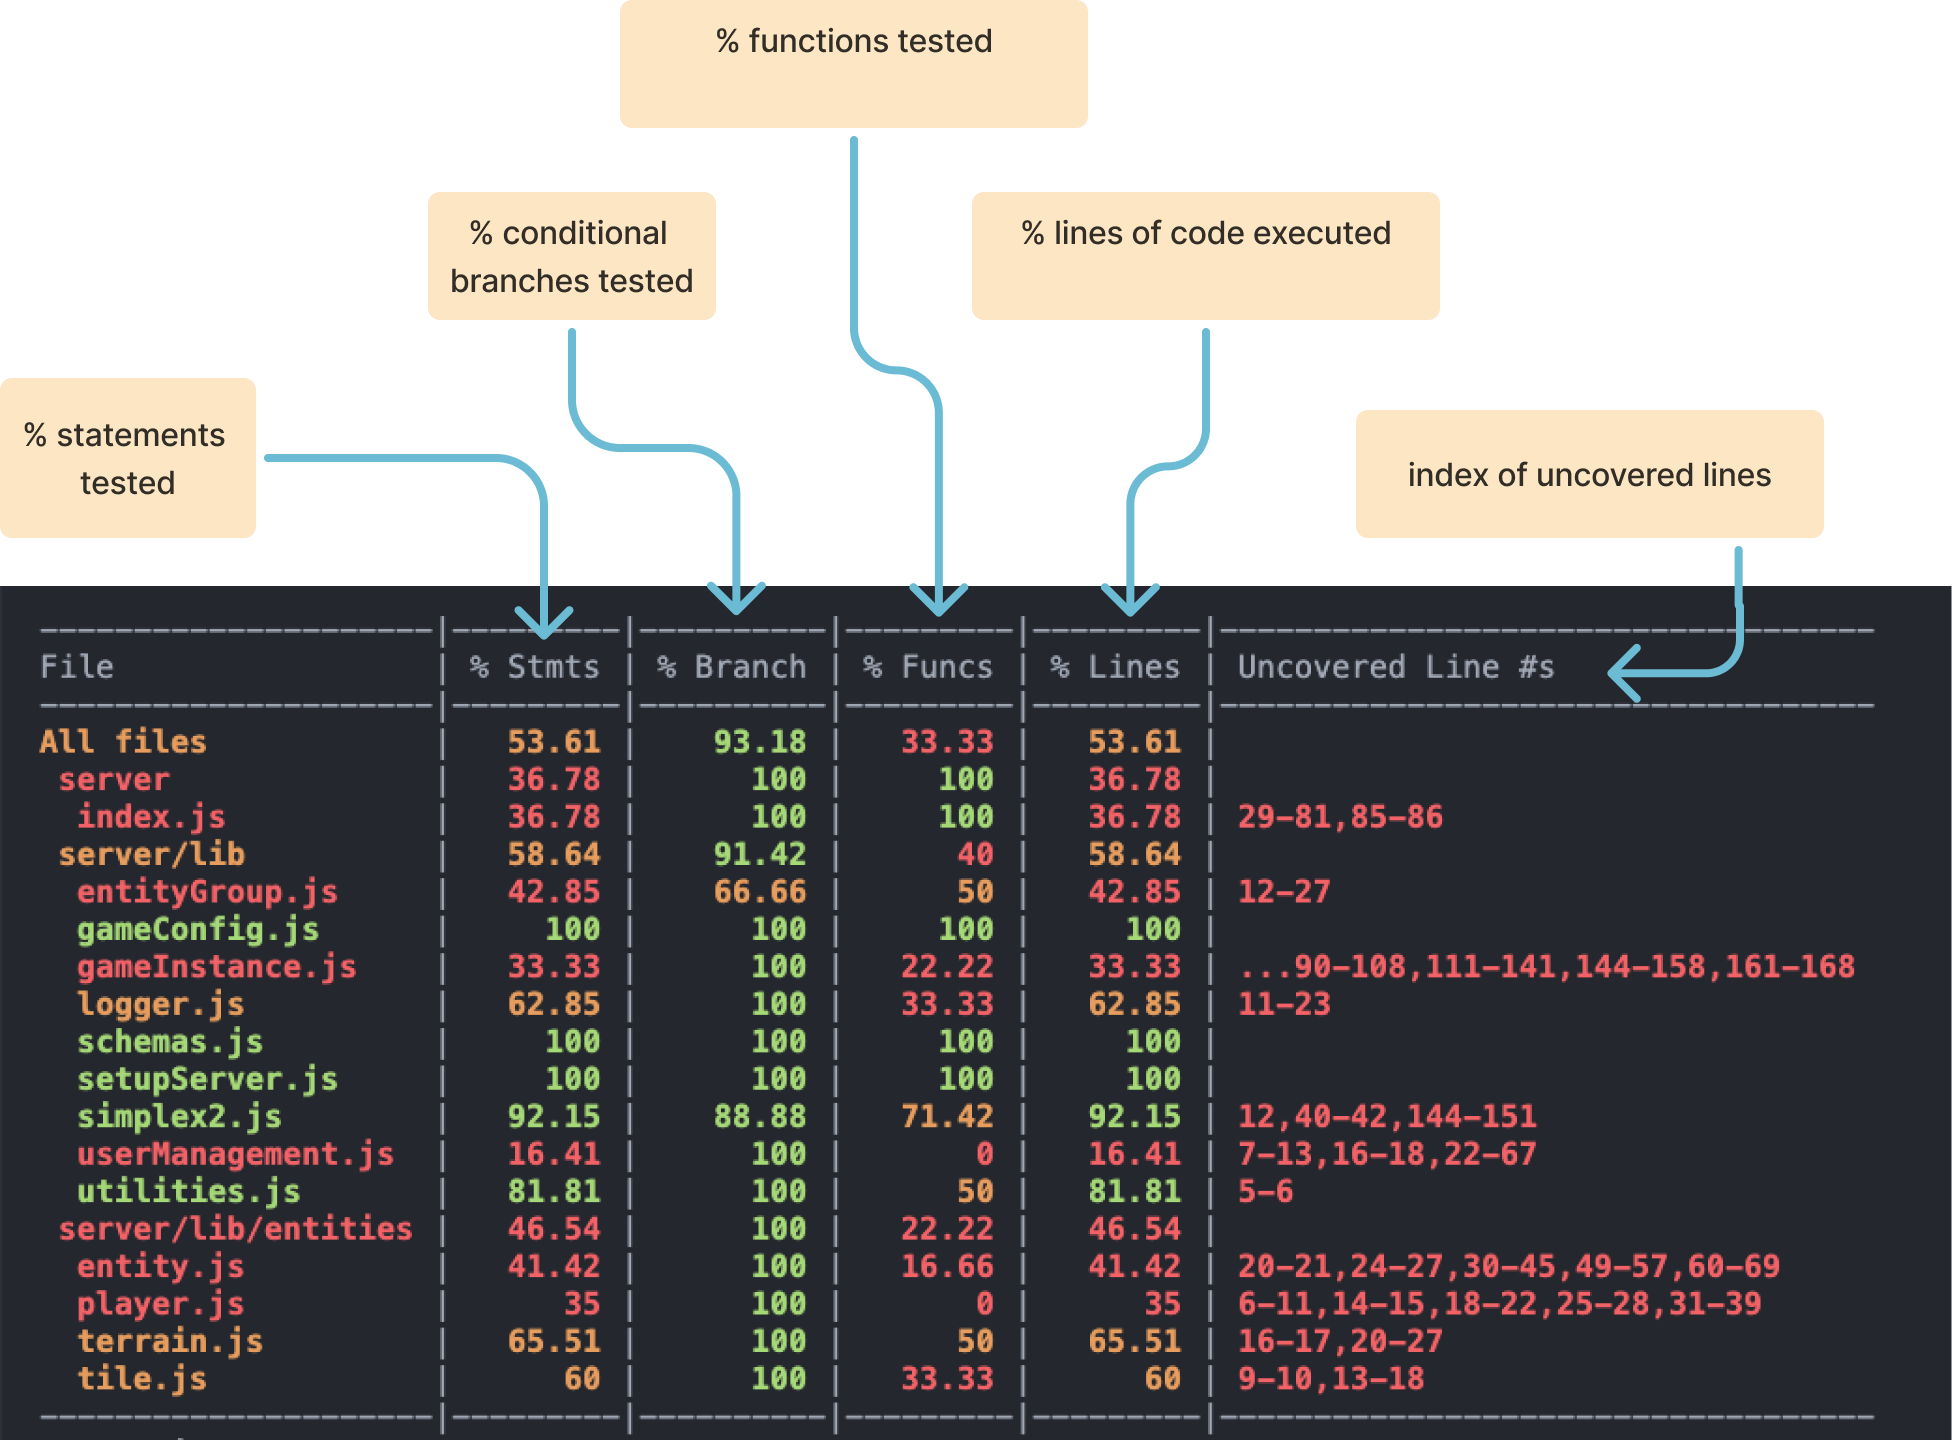
Here’s a guide for how to read these coverage results:
How Jest Tests are Executed / How to do unit testing within ESM modules
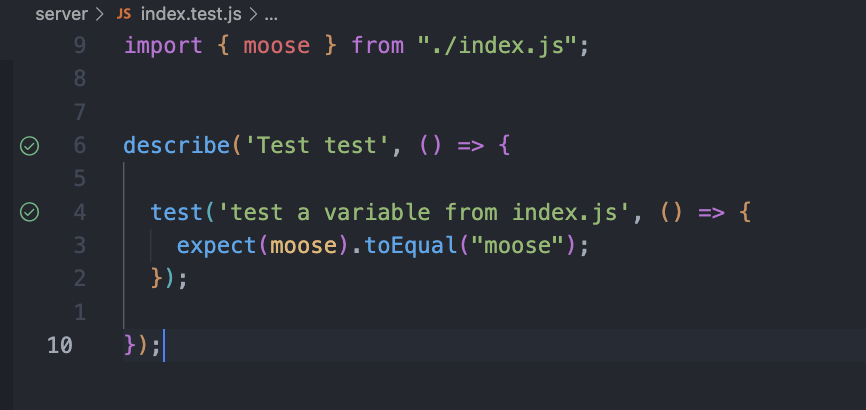
So I showed an example of a test with a describe grouping and an individual test block inside of it with an expect line. Intuitively, the way I thought this would work is to import a function, variable or class etc., and then run it against expectations, like how you could do so with vanilla JS and maybe the console.assert method.
The biggest departure from this expectation so far is that Jest seems to be running my entire index.js file. I think this may have something to do with the way that javascript modules are evaluated, but this is unexpected to me.
By adding the line detectOpenHandles: true to my jest.config.js file, I was able to prevent seeing all of these warning messages coming up from this file:
httpServer.listen(port, () => {
  log(`-->>> STARTED SERVER: ${port} <<<--`)
  console.log(`Listening on port ${port}`);
});
But I also found that I am coming up against issues later on, for example when using jest --watch, where running a test referencing this file clearly runs the server on port :3000, which causes conflicts as I run the test over a over again.
Apparently, this is just how JS modules work - the code in the top level of a module will be executed when that module is imported. This is fine if you are just defining a function, since that definition doesn’t actually do an action, even if it is basically creating one that can be used for later use. But httpServer.list() is a imperative, a command, and so it will be run immediately.
TLDR
When you import anything from a module, the entire module is evaluated from top to bottom, which means any code that’s not inside a function will run immediately.
Therefore, in order to do isolated unit testing in javascript, we need to make sure that any files we are importing JS from are organized in such a way that they omit all imperative code. Any code that gets run imperatively in those files will be run, which will cause weird side effects in our unit tests. Instead, we need everything in the file we are importing from to be a function, class, or variable, rather than a mutation or function call of some kind.
The only exception may be if we do want something to be called that, I dunno, doesn’t have any side effects outside of that file. Running a server definitely does.
In general though, it’s best to reserve the right to run tests in isolation though, so really if there’s any imperative code, it’s better to separate that out into a separate file so it doesn’t pollute the state of our unit tests.
Maybe this is a way to weed out imperative code in general - but that example of listening to requests on an endpoint sort of defies this logic. In order to serve our app, we need to do this. So I guess to keep our state clean, that leaves us with at least two options:
- Extract as much of the complex mechanisms from files with necessary imperative functions into their own files so that they can be safely unit tested in an isolated manner
- OR create flags that prevent those imperatives from being executed if we are loading them within our testing system.
The second one may be a useful option to keep in mind, but personally I’d like to avoid it as I feel like it makes the code more confusing and adds another flag that needs to be understood globally by anyone configuring or using the repo during deployment.
Jest Gotchas
A)
I know, I know, I was being dumb, but you can’t do:
test('Elijah Kennedy is capable of basic javascript', _=>{
	//
})
Because then you’re passing an argument to your callback I guess. So stick to:
  test('Elijah Kennedy is capable of basic javascript', ()=>{
	  //
  })